Network Analysis Using Igraph#
Installation#
Install
igraphInstall
pycairofor plotting
# pip not working
conda install pycairo
DEMO_DATA_ROOT = "../../../RepositoryData/data"
Creating Graphs#
#import igraph
from igraph import *
import cairo
g = Graph()
print(g)
IGRAPH U--- 0 0 --
Note
This summary consists of IGRAPH, followed by a four-character long code, the number of vertices, the number of edges, two dashes (–) and the name of the graph (i.e. the contents of the name attribute, if any)
g.add_vertices(10)
g.add_edges([(2, 3), (3, 4), (4, 5), (5, 3)])
print(g)
IGRAPH U--- 10 4 --
+ edges:
2--3 3--4 4--5 3--5
Vertex IDs will always be continuous. If edges are deleted, vertices may be re-numbered.
g.get_eid(3,4)
g.delete_edges(1)
summary(g)
IGRAPH U--- 10 3 --
Note
Use summary() instead of print() to avoid printing the edge lists.
Generating Graphs#
Deterministic graph generator
Stochastic graph generator
Erdős-Rényi random networks
Barabási-Albert networks
Geometric random graphs
Create a tree with 20 vertices and each vertex has two children. The tree is deterministic.
# Deterministic example
g = Graph.Tree(20, 2) #
plot(g, bbox=(200,200))
Create geometric random graph which has n points chosen randomly and uniformly inside the unit square and pairs of points closer to each other than a predefined distance d are connected by an edge.
Note
isomorphic() checks if two graphs are isomorphic or not.
g = Graph.GRG(20, 0.3)
summary(g)
plot(g, bbox=(200,200))
IGRAPH U--- 20 30 --
+ attr: x (v), y (v)
Create an Erdos-Renyi random graph, with (n, p, m) parameters
g = Graph.Erdos_Renyi(20, 0.2)
plot(g, bbox=(200,200))
Graph Attributes#
Vertices/Edges ID change when the number of vertices/edges changes in the Graph
These ID’s are always continuous or renumbered to be continuous.
Access vertices and edges:
Graph.vs
Graph.es
Access attributes:
Graph.vs["name"]
g = Graph.Tree(6,3)
plot(g, bbox=(200,200))
Add attributes to vertices/edges
g.vs["name"]=["John","Alice","Claire","Emily","Dennis","Esther"]
g.vs["name"]
['John', 'Alice', 'Claire', 'Emily', 'Dennis', 'Esther']
Check attributes of specific vertices/edges
g.vs[3].attributes()
{'name': 'Emily'}
Add graph-level attributes
g["date"]="2020-10-10"
g.vs[3].attributes()
g["date"]
'2020-10-10'
plot(g, bbox=(200,200))
Loading Data#
g = Graph.Read_Pajek(DEMO_DATA_ROOT + "/glossTG.paj")
summary(g)
IGRAPH UN-- 72 118 --
+ attr: id (v), name (v), x (v), y (v)
Querying vertices and edges based on attributes#
Check vertice-, edge-, and graph-level attributes.
g.vs[0].attributes()
{'id': 'Acyclic Graph', 'name': 'Acyclic Graph', 'x': 0.6519, 'y': 0.8284}
g.es[0].attributes()
{}
g.attributes()
[]
Selecting vertices and edges
g.vs.select(lambda v:v["name"]=="Tree").attributes()
['id', 'name', 'x', 'y']
Predefined keyword arguments for querying:
name_eqname_neqname_ltname_lename_gtname_gename_inname_notin
All the above name could be any of the attributes on which the query is made.
g.vs.select(name_in=("Tree","Graph","Bipartite"))
<igraph.VertexSeq at 0x7fec60805228>
The query can also be made on the structural properties of the vertices/edges.
All structural properties need to be precded by an underscore (_).
_degree_source/_from_target/_to_within: get vertices within the indices_between: get all edges in-between two nodes
Identify all vertices whose degrees are greater than 6.
r = g.vs.select(_degree_gt=6) # find nodes whose degress > 3

print([v["name"] for v in r])
['Arc', 'Digraph', 'Edge', 'Graph', 'Tree', 'Vertex', 'Walk']
Identify all edges that connect Tree and Graph
n1 = g.vs.select(name='Graph')
n2 = g.vs.select(name='Edge')
r = g.es.select(_between=(n1,n2))
print(len(r))
print([e for e in r])
1
[igraph.Edge(<igraph.Graph object at 0x7fec81363d68>, 42, {})]
Finding one vertex/edge with some attributes#
g.vs.find(name="Tree")
igraph.Vertex(<igraph.Graph object at 0x7fec81363d68>, 68, {'id': 'Tree', 'name': 'Tree', 'x': 0.5646, 'y': 0.8624})
g.degree("Vertex")
18
Structural Properties of Graphs#
Centrality Metrics:
g.degree()g.evcent()g.betweenness()g.edge_betweenness()g.pagerank()
# node degrees
g.degree()[:10]
g.betweenness("Vertex") # btwness centrality for ID "Vertex"
585.4799083183758
## Find out edge of highest cenrality
ebs = g.edge_betweenness()
max_eb = max(ebs)
[g.es[idx].tuple for idx, eb in enumerate(ebs) if eb == max_eb]
[(57, 68)]
# same functions
g.edge_betweenness()[:10]
g.es.edge_betweenness()[:10]
[26.372757651705022,
 60.53942431837168,
 21.082828282828277,
 37.917171717171705,
 59.0,
 91.11305726437305,
 109.57099377230959,
 25.868358438946682,
 11.31190476190476,
 42.78978701037525]
g.vs.select(_degree_gt=2)
<igraph.VertexSeq at 0x7fec60805e58>
Degree Distribution#
import matplotlib
import matplotlib.pyplot as plt
import numpy as np
%matplotlib inline
plt.style.use('fivethirtyeight')
matplotlib.rcParams['figure.dpi']= 150

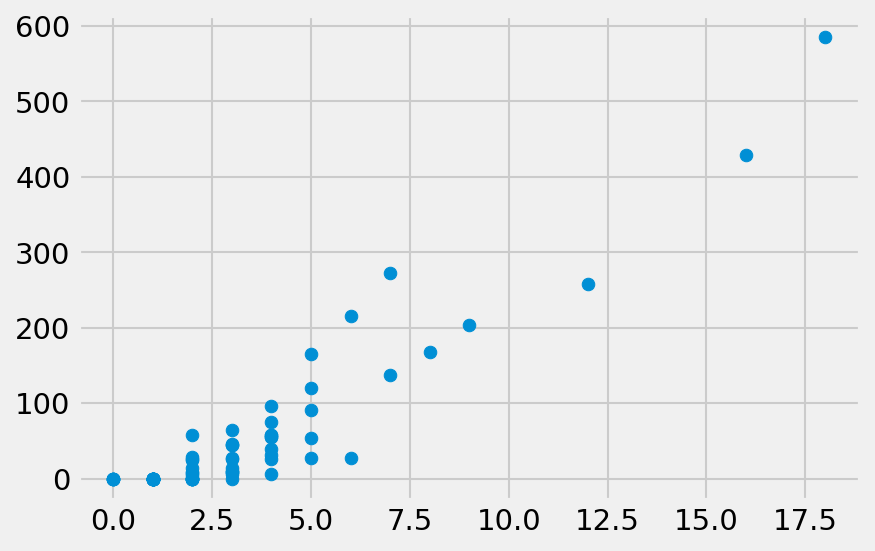
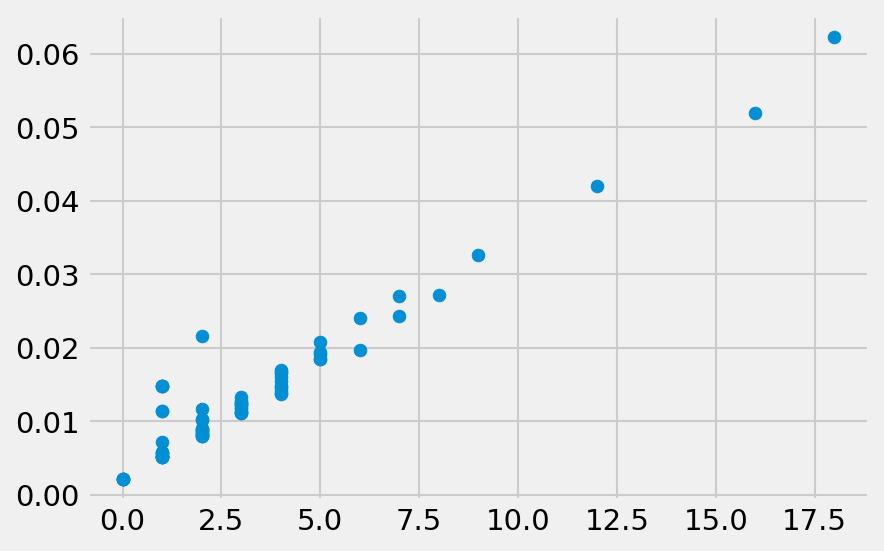
v_degree = g.degree()
v_betweenness = g.betweenness()
v_pagerank = g.pagerank()
Correlation
# correlation
plt.scatter(v_degree, v_betweenness)
<matplotlib.collections.PathCollection at 0x7fec81f38860>

plt.scatter(v_degree, v_pagerank)
<matplotlib.collections.PathCollection at 0x7fec81fc50b8>

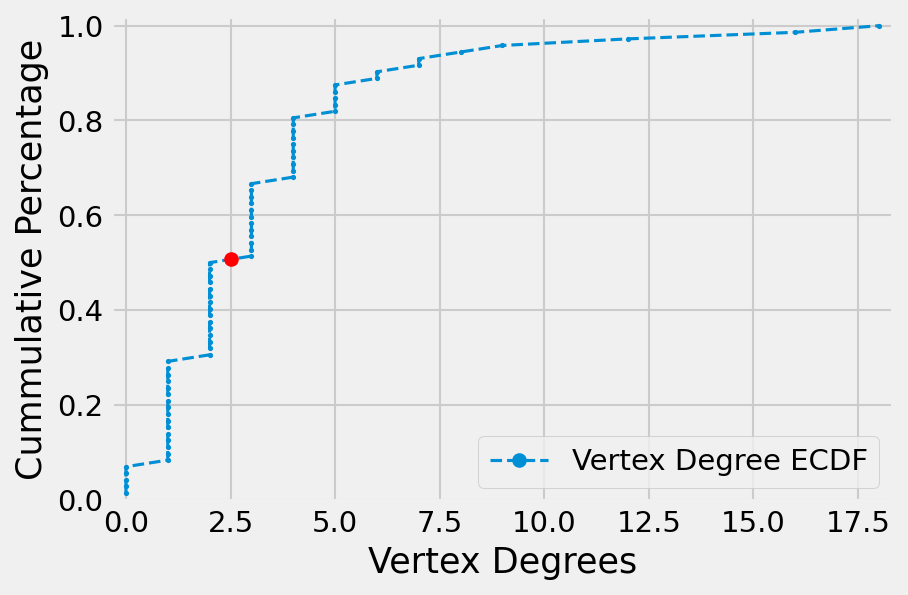
Degree Distribution ECDF
def ecdf(data):
    x = np.sort(data)
    y = np.arange(1, len(x)+1)/len(x) # percentiles
    return(x,y)

def plot_ecdf(data, xlabel=None, ylabel='Cummulative Percentage', label=None):
    x,y = ecdf(data)
    plt.plot(x, y, marker='.', markersize=3, linestyle='--', lw=1.5,label=label)
    plt.legend(markerscale=4)
    plt.xlabel(xlabel)
    plt.ylabel(ylabel)
    plt.margins(0.02)

    x_50 = np.percentile(x, 50)
    y_50 = np.percentile(y, 50)
    # mark 50th
    plt.plot(x_50, y_50, marker='o', color='red',
         linestyle='none')

plot_ecdf(v_degree, xlabel="Vertex Degrees", label="Vertex Degree ECDF")

Layout#
layout = g.layout_kamada_kawai()
plot(g, layout = layout, bbox=(400,800), margin=50)
v_colors = ['lightblue' if vd>6 else 'pink' for vd in v_degree]
Note
It is recommended to have aesthetic properties of the vertices and edges independent of their attributes.
plot(g, layout=layout, vertex_color = v_colors,
     bbox=(400,800), margin=40)
All the visual styles can be stored in a Python dictionary object and passed to plot() all at once.
visual_style={}
visual_style["vertex_size"] = [30 if vd>6 else 20 for vd in v_degree]
visual_style["vertex_color"] = v_colors
visual_style["vertex_label"] = g.vs["name"]
visual_style["vertex_label_size"] = [12 if vd>6 else 6 for vd in v_degree]
visual_style["vertex_shape"] = "circle"
visual_style["layout"]=layout
visual_style["bbox"]=(500,800)
visual_style["margin"]=40
plot(g, **visual_style)
Word Network Example#
import pickle

with open(DEMO_DATA_ROOT+'/reporting_verbs_chinese_edges_df.pickle', 'rb') as f:
    edges_df = pickle.load(f)
edges_df
| w1 | w2 | sim | |
|---|---|---|---|
| 0 | 認為 | 強調 | 0.768714 |
| 1 | 認為 | 因為 | 0.768123 |
| 2 | 認為 | 認爲 | 0.824715 |
| 3 | 認為 | 對於 | 0.757404 |
| 4 | 現在 | 因為 | 0.773691 |
| ... | ... | ... | ... |
| 9014 | 主張 | 提議 | 0.664787 |
| 9015 | 主張 | 見解 | 0.663773 |
| 9016 | 主張 | 權利 | 0.658277 |
| 9017 | 主張 | 言論 | 0.658076 |
| 9018 | 主張 | 認同 | 0.655625 |
785 rows × 3 columns
edges_tuples = [tuple(x) for x in edges_df.values]
g2 = Graph.TupleList(edges_tuples, directed=False)
summary(g2)
IGRAPH UN-- 180 785 --
+ attr: name (v)
plot(g2)
g2 = g2.simplify()
g2_fg = g2.community_fastgreedy()
g2_fg.optimal_count
nodes_membership = g2_fg.as_clustering(n=8).membership
print(nodes_membership)
[0, 0, 1, 0, 0, 1, 1, 1, 1, 1, 1, 1, 1, 1, 1, 1, 0, 0, 0, 0, 0, 0, 1, 1, 1, 1, 2, 1, 1, 1, 1, 0, 1, 0, 0, 0, 3, 3, 3, 3, 3, 4, 4, 4, 4, 5, 2, 1, 1, 1, 1, 1, 5, 5, 5, 5, 1, 6, 6, 0, 0, 0, 2, 0, 0, 2, 2, 2, 1, 1, 2, 0, 0, 2, 2, 2, 2, 1, 2, 7, 7, 2, 2, 2, 2, 2, 5, 2, 2, 1, 4, 4, 0, 2, 2, 1, 0, 5, 0, 0, 0, 2, 2, 0, 5, 5, 4, 7, 7, 2, 0, 0, 2, 2, 2, 2, 2, 2, 2, 2, 2, 2, 2, 2, 2, 2, 2, 2, 2, 2, 2, 2, 0, 0, 4, 0, 0, 0, 0, 0, 0, 0, 5, 0, 0, 0, 0, 4, 0, 0, 0, 7, 0, 0, 0, 0, 6, 6, 6, 6, 5, 5, 5, 5, 5, 5, 5, 5, 5, 5, 5, 5, 5, 7, 4, 4, 4, 4, 4, 4]
import matplotlib.pyplot as plt
# # from seaborn import color_palette
# palette = plt.get_cmap("Set3")
# palette(11)[1]
plt.rcParams['font.sans-serif']=["PingFang HK"]
plt.rcParams['axes.unicode_minus']= False
import seaborn as sns

palette = sns.color_palette('tab10')
from xpinyin import Pinyin
p = Pinyin()
p.get_pinyin(g2.vs['name'][1], tone_marks='numbers')
'qiang2-diao4'
# WIDTH = 3
# HEIGHT = 2
# PIXEL_SCALE = 200

# surface = cairo.ImageSurface(cairo.FORMAT_RGB24,
#                              WIDTH*PIXEL_SCALE,
#                              HEIGHT*PIXEL_SCALE)
# ctx = cairo.Context(surface)
# ctx.scale(PIXEL_SCALE, PIXEL_SCALE)

# ctx.rectangle(0, 0, WIDTH, HEIGHT)
# ctx.set_source_rgb(0.8, 0.8, 1)
# ctx.fill()

# # Drawing code
# ctx.set_source_rgb(1, 0, 0)
# ctx.set_font_size(0.25)
# ctx.select_font_face("Arial Unicode MS",
#                      cairo.FONT_SLANT_NORMAL,
#                      cairo.FONT_WEIGHT_NORMAL)
# ctx.move_to(0.5, 0.5)
# ctx.show_text("我是中文")
# # End of drawing code

# surface.write_to_png('text.png')
# WIDTH = 10
# HEIGHT = 8
# PIXEL_SCALE = 200

# surface = cairo.ImageSurface(cairo.FORMAT_RGB24,
#                              WIDTH*PIXEL_SCALE,
#                              HEIGHT*PIXEL_SCALE)
# ctx = cairo.Context(surface)
# ctx.scale(PIXEL_SCALE, PIXEL_SCALE)

# ctx.rectangle(0, 0, WIDTH, HEIGHT)
#ctx.set_source_rgb(0.8, 0.8, 1)
#ctx.fill()

# Drawing code
# ctx.set_source_rgb(1, 0, 0)
# ctx.set_font_size(0.25)
# ctx.select_font_face("sans",
#                      cairo.FONT_SLANT_NORMAL,
#                      cairo.FONT_WEIGHT_NORMAL)

layout = g2.layout_fruchterman_reingold()

visual_style={}
visual_style["vertex_size"] = 10
visual_style["vertex_color"] = [palette[m+2] for m in nodes_membership]

#visual_style["vertex_label"] = [p.get_pinyin(n, "",tone_marks='numbers') for n in g2.vs['name']]
visual_style["vertex_label"] = g2.vs['name']
visual_style["labels"] = g2.vs['name']
visual_style["vertex_label_dist"] =1
visual_style["vertex_label_size"]= 8
#visual_style["vertex_label_size"] = [12 if vd>6 else 6 for vd in v_degree]
#visual_style["vertex_shape"] = "circle"

visual_style["edge_color"] = "lightgrey"
visual_style["edge_width"] = 1
visual_style["edge_curved"] = 0.1

visual_style["layout"]=layout
visual_style["bbox"]=(500,800)
visual_style["margin"]=40

plot(g2, target="text.png", **visual_style)
svg_colors=['aqua','aquamarine','coral','cornsilk',
           'honeydew','lemonchiffon','lightpink','plum']
visual_style["colors"] = [svg_colors[m] for m in nodes_membership]


g2.write_svg("text.svg",
             labels=visual_style["vertex_label"],
             layout=layout,
             width=600,
             height=800,
             colors=visual_style["colors"],
             vertex_size=visual_style["vertex_size"],
             edge_colors= ['whitesmoke' for i in range(len(g2.es))],
             #edge_stroke_widths=visual_style["edge_width"],
             font_size= 8
            )
# # g2_plot.save('text2.png')
# # surface.write_to_png('text.png')

from IPython.display import SVG, display
display(SVG('text.svg'))
Chinese characters are not showing up in igraph due to the issues of
cairoChinese support.A workaround is to save the graph in
SVGThen open the SVG with text editor
Then find all
font-family:...setting and replace the font name with system-compatible Chinese font names.

