
Magic R#
This is a notebook based on an R kernel.
To install the system default R kernel to work with Jupyter Notebook:
Open the terminal
Run the following commands in the terminal (running in RStudio does not work)
# intiate R
$ R
# install packages
install.package("IRkernel")
IRkernel::installspec()
This step is necessary if we want to use the default system R kernel instead of the R provided by Anaconda
After installing the R packages, we can use the R kernel in a jupyter notebook. And the entire notebook has to use the same R kernel.
If we need to combine python and R codes in one notebook, we need to do the following:
Install the rpy2 module
pip install rpy2
Use magic command to switch to R codes
%%R
library(dplyr)

%% R -i DUMP_PYTHON_OBJECTS_FOR_R
Some other parameters
%%R -i df -w 5 -h 5 --units in -r 200
# import df from global environment
# make default figure size 5 by 5 inches with 200 dpi resolution
Other parameters for rmagic, see this post
Running R codes in Notebook#
After installing the R kernel, we can create an entire notebook, which is based on the system default R kernel.
This notebook is an example. (awesome!)
library(ggplot2)
library(tidyverse)
library(quanteda)
Warning message:
“replacing previous import ‘vctrs::data_frame’ by ‘tibble::data_frame’ when loading ‘dplyr’”
── Attaching packages ─────────────────────────────────────── tidyverse 1.3.0 ──

✔ tibble  3.0.3     ✔ dplyr   1.0.0
✔ tidyr   1.1.2     ✔ stringr 1.4.0
✔ readr   1.3.1     ✔ forcats 0.5.0
✔ purrr   0.3.4

── Conflicts ────────────────────────────────────────── tidyverse_conflicts() ──
✖ dplyr::filter() masks stats::filter()
✖ dplyr::lag()    masks stats::lag()

Package version: 2.0.1

Parallel computing: 2 of 4 threads used.

See https://quanteda.io for tutorials and examples.


Attaching package: ‘quanteda’


The following object is masked from ‘jupyter:irkernel’:

    View


The following object is masked from ‘package:utils’:

    View
getwd()
version
sessionInfo()
               _
platform       x86_64-apple-darwin15.6.0
arch           x86_64
os             darwin15.6.0
system         x86_64, darwin15.6.0
status
major          3
minor          6.3
year           2020
month          02
day            29
svn rev        77875
language       R
version.string R version 3.6.3 (2020-02-29)
nickname       Holding the Windsock
R version 3.6.3 (2020-02-29)
Platform: x86_64-apple-darwin15.6.0 (64-bit)
Running under: macOS Catalina 10.15.7

Matrix products: default
BLAS:   /Library/Frameworks/R.framework/Versions/3.6/Resources/lib/libRblas.0.dylib
LAPACK: /Library/Frameworks/R.framework/Versions/3.6/Resources/lib/libRlapack.dylib

locale:
[1] C/UTF-8/C/C/C/C

attached base packages:
[1] stats     graphics  grDevices utils     datasets  methods   base

other attached packages:
 [1] quanteda_2.0.1  forcats_0.5.0   stringr_1.4.0   dplyr_1.0.0
 [5] purrr_0.3.4     readr_1.3.1     tidyr_1.1.2     tibble_3.0.3
 [9] tidyverse_1.3.0 ggplot2_3.3.2

loaded via a namespace (and not attached):
 [1] pbdZMQ_0.3-3       tidyselect_1.1.0   repr_1.1.0         lattice_0.20-41
 [5] haven_2.2.0        colorspace_1.4-1   vctrs_0.3.4        generics_0.0.2
 [9] usethis_1.6.1      htmltools_0.5.0    base64enc_0.1-3    rlang_0.4.7
[13] pillar_1.4.6       glue_1.4.2         withr_2.2.0        DBI_1.1.0
[17] dbplyr_1.4.3       modelr_0.1.7       readxl_1.3.1       uuid_0.1-4
[21] lifecycle_0.2.0    munsell_0.5.0      gtable_0.3.0       cellranger_1.1.0
[25] rvest_0.3.5        evaluate_0.14      fansi_0.4.1        broom_0.7.1
[29] IRdisplay_0.7.0    Rcpp_1.0.4.6       backports_1.1.9    scales_1.1.1
[33] IRkernel_1.1.1     RcppParallel_5.0.1 jsonlite_1.7.0     fs_1.4.1
[37] fastmatch_1.1-0    stopwords_2.0      hms_0.5.3          digest_0.6.25
[41] stringi_1.4.6      grid_3.6.3         cli_2.0.2          tools_3.6.3
[45] magrittr_1.5       crayon_1.3.4       pkgconfig_2.0.3    ellipsis_0.3.1
[49] Matrix_1.2-18      data.table_1.12.8  xml2_1.3.2         reprex_0.3.0
[53] lubridate_1.7.9    assertthat_0.2.1   httr_1.4.1         rstudioapi_0.11
[57] R6_2.4.1           compiler_3.6.3
head(iris)
| Sepal.Length | Sepal.Width | Petal.Length | Petal.Width | Species | |
|---|---|---|---|---|---|
| <dbl> | <dbl> | <dbl> | <dbl> | <fct> | |
| 1 | 5.1 | 3.5 | 1.4 | 0.2 | setosa |
| 2 | 4.9 | 3.0 | 1.4 | 0.2 | setosa |
| 3 | 4.7 | 3.2 | 1.3 | 0.2 | setosa |
| 4 | 4.6 | 3.1 | 1.5 | 0.2 | setosa |
| 5 | 5.0 | 3.6 | 1.4 | 0.2 | setosa |
| 6 | 5.4 | 3.9 | 1.7 | 0.4 | setosa |
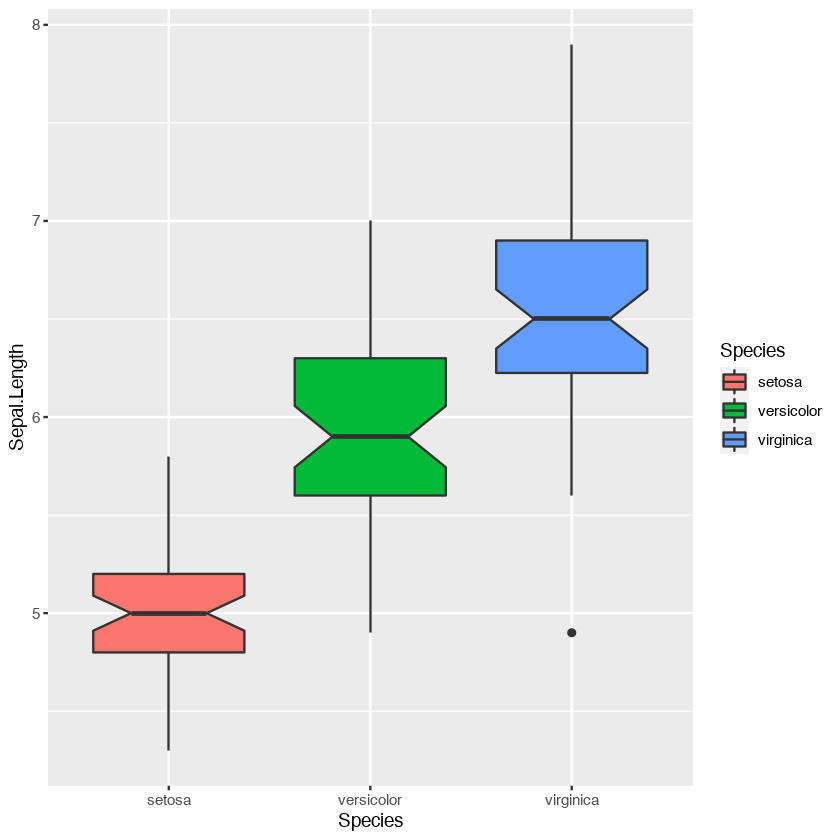
ggplot(iris, aes(Species, Sepal.Length, fill=Species)) +
geom_boxplot(notch=T)
iris %>%
filter(Sepal.Length > 5) %>%
head(10)
| Sepal.Length | Sepal.Width | Petal.Length | Petal.Width | Species | |
|---|---|---|---|---|---|
| <dbl> | <dbl> | <dbl> | <dbl> | <fct> | |
| 1 | 5.1 | 3.5 | 1.4 | 0.2 | setosa |
| 2 | 5.4 | 3.9 | 1.7 | 0.4 | setosa |
| 3 | 5.4 | 3.7 | 1.5 | 0.2 | setosa |
| 4 | 5.8 | 4.0 | 1.2 | 0.2 | setosa |
| 5 | 5.7 | 4.4 | 1.5 | 0.4 | setosa |
| 6 | 5.4 | 3.9 | 1.3 | 0.4 | setosa |
| 7 | 5.1 | 3.5 | 1.4 | 0.3 | setosa |
| 8 | 5.7 | 3.8 | 1.7 | 0.3 | setosa |
| 9 | 5.1 | 3.8 | 1.5 | 0.3 | setosa |
| 10 | 5.4 | 3.4 | 1.7 | 0.2 | setosa |