Machine Learning with Sklearn – Regression#
Data#
import pandas as pd
import numpy as np

house = pd.read_csv("../../../RepositoryData/data/hands-on-ml/housing.csv")
house.head()
| longitude | latitude | housing_median_age | total_rooms | total_bedrooms | population | households | median_income | median_house_value | ocean_proximity | |
|---|---|---|---|---|---|---|---|---|---|---|
| 0 | -122.23 | 37.88 | 41.0 | 880.0 | 129.0 | 322.0 | 126.0 | 8.3252 | 452600.0 | NEAR BAY |
| 1 | -122.22 | 37.86 | 21.0 | 7099.0 | 1106.0 | 2401.0 | 1138.0 | 8.3014 | 358500.0 | NEAR BAY |
| 2 | -122.24 | 37.85 | 52.0 | 1467.0 | 190.0 | 496.0 | 177.0 | 7.2574 | 352100.0 | NEAR BAY |
| 3 | -122.25 | 37.85 | 52.0 | 1274.0 | 235.0 | 558.0 | 219.0 | 5.6431 | 341300.0 | NEAR BAY |
| 4 | -122.25 | 37.85 | 52.0 | 1627.0 | 280.0 | 565.0 | 259.0 | 3.8462 | 342200.0 | NEAR BAY |
house.info()
<class 'pandas.core.frame.DataFrame'>
RangeIndex: 20640 entries, 0 to 20639
Data columns (total 10 columns):
 #   Column              Non-Null Count  Dtype
---  ------              --------------  -----
 0   longitude           20640 non-null  float64
 1   latitude            20640 non-null  float64
 2   housing_median_age  20640 non-null  float64
 3   total_rooms         20640 non-null  float64
 4   total_bedrooms      20433 non-null  float64
 5   population          20640 non-null  float64
 6   households          20640 non-null  float64
 7   median_income       20640 non-null  float64
 8   median_house_value  20640 non-null  float64
 9   ocean_proximity     20640 non-null  object
dtypes: float64(9), object(1)
memory usage: 1.6+ MB
house['ocean_proximity'].value_counts()
<1H OCEAN     9136
INLAND        6551
NEAR OCEAN    2658
NEAR BAY      2290
ISLAND           5
Name: ocean_proximity, dtype: int64
house.describe()
| longitude | latitude | housing_median_age | total_rooms | total_bedrooms | population | households | median_income | median_house_value | |
|---|---|---|---|---|---|---|---|---|---|
| count | 20640.000000 | 20640.000000 | 20640.000000 | 20640.000000 | 20433.000000 | 20640.000000 | 20640.000000 | 20640.000000 | 20640.000000 |
| mean | -119.569704 | 35.631861 | 28.639486 | 2635.763081 | 537.870553 | 1425.476744 | 499.539680 | 3.870671 | 206855.816909 |
| std | 2.003532 | 2.135952 | 12.585558 | 2181.615252 | 421.385070 | 1132.462122 | 382.329753 | 1.899822 | 115395.615874 |
| min | -124.350000 | 32.540000 | 1.000000 | 2.000000 | 1.000000 | 3.000000 | 1.000000 | 0.499900 | 14999.000000 |
| 25% | -121.800000 | 33.930000 | 18.000000 | 1447.750000 | 296.000000 | 787.000000 | 280.000000 | 2.563400 | 119600.000000 |
| 50% | -118.490000 | 34.260000 | 29.000000 | 2127.000000 | 435.000000 | 1166.000000 | 409.000000 | 3.534800 | 179700.000000 |
| 75% | -118.010000 | 37.710000 | 37.000000 | 3148.000000 | 647.000000 | 1725.000000 | 605.000000 | 4.743250 | 264725.000000 |
| max | -114.310000 | 41.950000 | 52.000000 | 39320.000000 | 6445.000000 | 35682.000000 | 6082.000000 | 15.000100 | 500001.000000 |
Visualization#
%matplotlib inline
import matplotlib.pyplot as plt
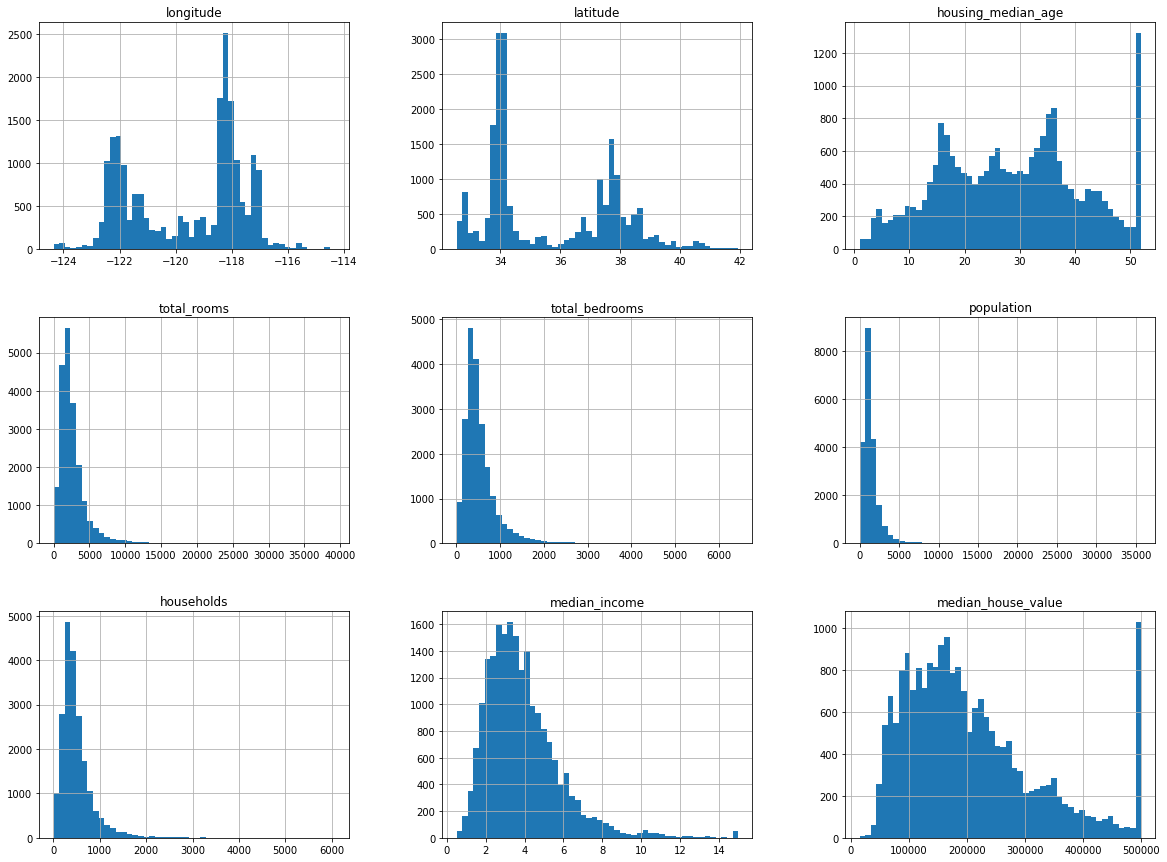
house.hist(bins=50, figsize=(20,15))
plt.show()

Train-Test Split#
Simple random sampling#
from sklearn.model_selection import train_test_split
train, test = train_test_split(house, test_size = 0.2, random_state=42)
len(train)
16512
len(test)
4128
Stratified Random Sampling#
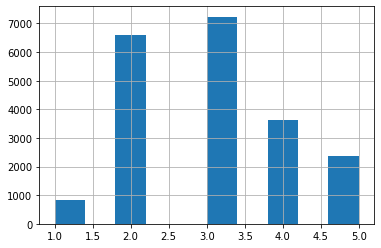
The sampling should consider the income distributions.
house['income_cat'] = pd.cut(house['median_income'],
                            bins=[0,1.5, 3.0, 4.5, 6.0,np.inf],
                            labels=[1,2,3,4,5])
house['income_cat'].hist()
<AxesSubplot:>

from sklearn.model_selection import StratifiedShuffleSplit

splitter = StratifiedShuffleSplit(n_splits=1, test_size=0.2, random_state=42)
for train_index, test_index in splitter.split(house, house['income_cat']):
    train_strat = house.loc[train_index]
    test_strat = house.loc[test_index]
train_strat['income_cat'].value_counts()/len(train_strat)
3    0.350594
2    0.318859
4    0.176296
5    0.114402
1    0.039850
Name: income_cat, dtype: float64
test_strat['income_cat'].value_counts()/len(test_strat)
3    0.350533
2    0.318798
4    0.176357
5    0.114583
1    0.039729
Name: income_cat, dtype: float64
for set_ in (train_strat, test_strat):
    set_.drop("income_cat", axis = 1, inplace=True)
Exploring Training Data#
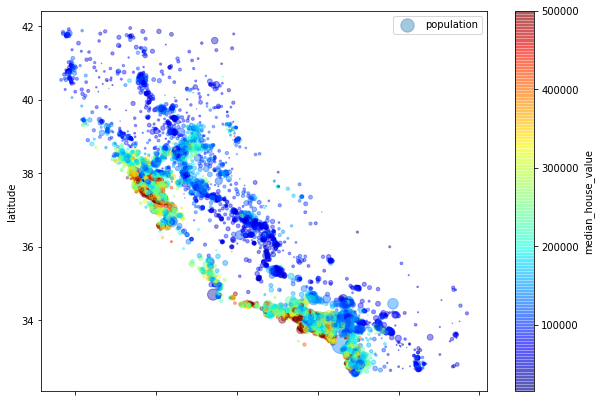
train_strat.plot(kind="scatter", x="longitude", y="latitude", alpha=0.4,
                s=train_strat["population"]/100, label="population",figsize=(10,7),
                c="median_house_value", cmap=plt.get_cmap("jet"),colorbar=True,)
plt.legend()

## size: population
## color: median house value
<matplotlib.legend.Legend at 0x7fb45b976470>

Preparing Data for ML#
Wrap things in functions
Allow you to reproduce the same transformations easily on any dataset
Build a self-defined library of transformation functions
Allow you to apply the same transformation to new data in live system
Allow you to experiment with different transformations easily
housing = train_strat.drop("median_house_value", axis=1)
housing_labels = train_strat["median_house_value"].copy()
housing
| longitude | latitude | housing_median_age | total_rooms | total_bedrooms | population | households | median_income | ocean_proximity | |
|---|---|---|---|---|---|---|---|---|---|
| 17606 | -121.89 | 37.29 | 38.0 | 1568.0 | 351.0 | 710.0 | 339.0 | 2.7042 | <1H OCEAN |
| 18632 | -121.93 | 37.05 | 14.0 | 679.0 | 108.0 | 306.0 | 113.0 | 6.4214 | <1H OCEAN |
| 14650 | -117.20 | 32.77 | 31.0 | 1952.0 | 471.0 | 936.0 | 462.0 | 2.8621 | NEAR OCEAN |
| 3230 | -119.61 | 36.31 | 25.0 | 1847.0 | 371.0 | 1460.0 | 353.0 | 1.8839 | INLAND |
| 3555 | -118.59 | 34.23 | 17.0 | 6592.0 | 1525.0 | 4459.0 | 1463.0 | 3.0347 | <1H OCEAN |
| ... | ... | ... | ... | ... | ... | ... | ... | ... | ... |
| 6563 | -118.13 | 34.20 | 46.0 | 1271.0 | 236.0 | 573.0 | 210.0 | 4.9312 | INLAND |
| 12053 | -117.56 | 33.88 | 40.0 | 1196.0 | 294.0 | 1052.0 | 258.0 | 2.0682 | INLAND |
| 13908 | -116.40 | 34.09 | 9.0 | 4855.0 | 872.0 | 2098.0 | 765.0 | 3.2723 | INLAND |
| 11159 | -118.01 | 33.82 | 31.0 | 1960.0 | 380.0 | 1356.0 | 356.0 | 4.0625 | <1H OCEAN |
| 15775 | -122.45 | 37.77 | 52.0 | 3095.0 | 682.0 | 1269.0 | 639.0 | 3.5750 | NEAR BAY |
16512 rows × 9 columns
NA values#
from sklearn.impute import SimpleImputer

imputer = SimpleImputer(strategy="median")

housing_num = housing.drop("ocean_proximity", axis=1)
imputer.fit(housing_num)
SimpleImputer(add_indicator=False, copy=True, fill_value=None,
              missing_values=nan, strategy='median', verbose=0)
imputer.statistics_
array([-118.51  ,   34.26  ,   29.    , 2119.5   ,  433.    , 1164.    ,
        408.    ,    3.5409])
housing_num.median()
longitude             -118.5100
latitude                34.2600
housing_median_age      29.0000
total_rooms           2119.5000
total_bedrooms         433.0000
population            1164.0000
households             408.0000
median_income            3.5409
dtype: float64
X = imputer.transform(housing_num)
housing_tr = pd.DataFrame(X, columns=housing_num.columns)
housing_tr
| longitude | latitude | housing_median_age | total_rooms | total_bedrooms | population | households | median_income | |
|---|---|---|---|---|---|---|---|---|
| 0 | -121.89 | 37.29 | 38.0 | 1568.0 | 351.0 | 710.0 | 339.0 | 2.7042 |
| 1 | -121.93 | 37.05 | 14.0 | 679.0 | 108.0 | 306.0 | 113.0 | 6.4214 |
| 2 | -117.20 | 32.77 | 31.0 | 1952.0 | 471.0 | 936.0 | 462.0 | 2.8621 |
| 3 | -119.61 | 36.31 | 25.0 | 1847.0 | 371.0 | 1460.0 | 353.0 | 1.8839 |
| 4 | -118.59 | 34.23 | 17.0 | 6592.0 | 1525.0 | 4459.0 | 1463.0 | 3.0347 |
| ... | ... | ... | ... | ... | ... | ... | ... | ... |
| 16507 | -118.13 | 34.20 | 46.0 | 1271.0 | 236.0 | 573.0 | 210.0 | 4.9312 |
| 16508 | -117.56 | 33.88 | 40.0 | 1196.0 | 294.0 | 1052.0 | 258.0 | 2.0682 |
| 16509 | -116.40 | 34.09 | 9.0 | 4855.0 | 872.0 | 2098.0 | 765.0 | 3.2723 |
| 16510 | -118.01 | 33.82 | 31.0 | 1960.0 | 380.0 | 1356.0 | 356.0 | 4.0625 |
| 16511 | -122.45 | 37.77 | 52.0 | 3095.0 | 682.0 | 1269.0 | 639.0 | 3.5750 |
16512 rows × 8 columns
Data Type Conversion#
Categorical to Ordinal
from sklearn.preprocessing import OrdinalEncoder
ordinal_encoder = OrdinalEncoder(categories='auto')
ocean_proximity_cat = housing[["ocean_proximity"]]
ocean_proximity_cat.head(10)
| ocean_proximity | |
|---|---|
| 17606 | <1H OCEAN |
| 18632 | <1H OCEAN |
| 14650 | NEAR OCEAN |
| 3230 | INLAND |
| 3555 | <1H OCEAN |
| 19480 | INLAND |
| 8879 | <1H OCEAN |
| 13685 | INLAND |
| 4937 | <1H OCEAN |
| 4861 | <1H OCEAN |
ocean_proximity_ordinal = ordinal_encoder.fit_transform(ocean_proximity_cat)
ocean_proximity_ordinal[:10]
array([[0.],
       [0.],
       [4.],
       [1.],
       [0.],
       [1.],
       [0.],
       [1.],
       [0.],
       [0.]])
ordinal_encoder.categories_
[array(['<1H OCEAN', 'INLAND', 'ISLAND', 'NEAR BAY', 'NEAR OCEAN'],
       dtype=object)]
pd.DataFrame(ocean_proximity_oridinal).value_counts()
0.0    7276
1.0    5263
4.0    2124
3.0    1847
2.0       2
dtype: int64
One-hot encoding
from sklearn.preprocessing import OneHotEncoder
onehot_encoder = OneHotEncoder()
ocean_proximity_onehot = onehot_encoder.fit_transform(ocean_proximity_cat)
ocean_proximity_onehot
<16512x5 sparse matrix of type '<class 'numpy.float64'>'
	with 16512 stored elements in Compressed Sparse Row format>
ocean_proximity_onehot.toarray()
array([[1., 0., 0., 0., 0.],
       [1., 0., 0., 0., 0.],
       [0., 0., 0., 0., 1.],
       ...,
       [0., 1., 0., 0., 0.],
       [1., 0., 0., 0., 0.],
       [0., 0., 0., 1., 0.]])
Feature Scaling#
from sklearn.preprocessing import StandardScaler, MinMaxScaler
standard_scaler = StandardScaler()
minmax_scaler = MinMaxScaler()

housing_num_minmax = minmax_scaler.fit_transform(housing_num)
housing_num_standard = standard_scaler.fit_transform(housing_num)
housing_num_minmax
array([[0.24501992, 0.50478215, 0.7254902 , ..., 0.01981558, 0.06292009,
        0.15201859],
       [0.24103586, 0.47927736, 0.25490196, ..., 0.00849239, 0.02072442,
        0.40837368],
       [0.71215139, 0.02444208, 0.58823529, ..., 0.02614984, 0.08588499,
        0.1629081 ],
       ...,
       [0.79183267, 0.16471838, 0.15686275, ..., 0.05871801, 0.14245706,
        0.19119736],
       [0.6314741 , 0.1360255 , 0.58823529, ..., 0.03792147, 0.0660941 ,
        0.24569316],
       [0.18924303, 0.55579171, 1.        , ..., 0.03548306, 0.11893204,
        0.21207294]])
housing_num_standard
array([[-1.15604281,  0.77194962,  0.74333089, ..., -0.63621141,
        -0.42069842, -0.61493744],
       [-1.17602483,  0.6596948 , -1.1653172 , ..., -0.99833135,
        -1.02222705,  1.33645936],
       [ 1.18684903, -1.34218285,  0.18664186, ..., -0.43363936,
        -0.0933178 , -0.5320456 ],
       ...,
       [ 1.58648943, -0.72478134, -1.56295222, ...,  0.60790363,
         0.71315642, -0.3167053 ],
       [ 0.78221312, -0.85106801,  0.18664186, ..., -0.05717804,
        -0.37545069,  0.09812139],
       [-1.43579109,  0.99645926,  1.85670895, ..., -0.13515931,
         0.3777909 , -0.15779865]])
Transformation Pipelines#
from sklearn.pipeline import Pipeline

num_pipeline = Pipeline([
    ('imputer', SimpleImputer(strategy="median")),
    ('standardizer', StandardScaler()),
])
housing_num_tr = num_pipeline.fit_transform(housing_num)
housing_num_tr
array([[-1.15604281,  0.77194962,  0.74333089, ..., -0.63621141,
        -0.42069842, -0.61493744],
       [-1.17602483,  0.6596948 , -1.1653172 , ..., -0.99833135,
        -1.02222705,  1.33645936],
       [ 1.18684903, -1.34218285,  0.18664186, ..., -0.43363936,
        -0.0933178 , -0.5320456 ],
       ...,
       [ 1.58648943, -0.72478134, -1.56295222, ...,  0.60790363,
         0.71315642, -0.3167053 ],
       [ 0.78221312, -0.85106801,  0.18664186, ..., -0.05717804,
        -0.37545069,  0.09812139],
       [-1.43579109,  0.99645926,  1.85670895, ..., -0.13515931,
         0.3777909 , -0.15779865]])
Handle all columns all at once
from sklearn.compose import ColumnTransformer
num_columns = list(housing_num)
cat_columns = ['ocean_proximity']
full_pipeline = ColumnTransformer([
    ('num', num_pipeline, num_columns),
    ('cat', OneHotEncoder(), cat_columns)
])
housing_prepared = full_pipeline.fit_transform(housing)
Important
The output of the full_pipeline includes more columns than the original data frame housing. This is due to the one-hot encoding transformation.
Select and Train a Model#
Linear Regresssion
from sklearn.linear_model import LinearRegression

lin_reg = LinearRegression()
lin_reg.fit(housing_prepared, housing_labels)

from sklearn.metrics import mean_squared_error

housing_predictions = lin_reg.predict(housing_prepared)

lin_mse = mean_squared_error(housing_labels, housing_predictions)
lin_rmes = np.sqrt(lin_mse)
lin_rmes
69055.57008288472
Decision Tree
from sklearn.tree import DecisionTreeRegressor
tree_reg = DecisionTreeRegressor()
tree_reg.fit(housing_prepared, housing_labels)

tree_mse = mean_squared_error(housing_labels, tree_reg.predict(housing_prepared))
tree_rmes = np.sqrt(tree_mse)
tree_rmes
0.0
Cross Validation to check over/under-fitting
from sklearn.model_selection import cross_val_score
CV for Decision Tree
tree_scores = cross_val_score(tree_reg, housing_prepared, housing_labels,
                             scoring="neg_mean_squared_error", cv=10)
tree_rmse_cv = np.sqrt(-tree_scores)
tree_rmse_cv
array([67139.82432539, 67382.97266737, 73570.81763384, 68716.64962785,
       67808.75573625, 75295.66005943, 66336.18100097, 69901.7711193 ,
       69017.19332426, 69541.31134573])
def display_cv_scores(scores):
    print('Scores:', scores)
    print('Mean:', scores.mean())
    print('Standard deviation:', scores.std())
display_cv_scores(tree_rmse_cv)
Scores: [67139.82432539 67382.97266737 73570.81763384 68716.64962785
 67808.75573625 75295.66005943 66336.18100097 69901.7711193
 69017.19332426 69541.31134573]
Mean: 69471.1136840389
Standard deviation: 2721.856830394127
CV for Linear Regression
linreg_scores = cross_val_score(lin_reg, housing_prepared, housing_labels,
                                scoring="neg_mean_squared_error", cv=10)
linreg_rmse_cv = np.sqrt(-linreg_scores)
display_cv_scores(linreg_rmse_cv)
Scores: [67452.77701485 67389.76532656 68361.84864912 74651.7801139
 68314.56738182 71640.79787192 65361.14176205 68571.62738037
 72475.91110732 68098.06828865]
Mean: 69231.82848965636
Standard deviation: 2656.3702353976896
CV for Random Forest
from sklearn.ensemble import RandomForestRegressor
forest_reg = RandomForestRegressor()
forest_scores = cross_val_score(forest_reg, housing_prepared, housing_labels,
                               scoring="neg_mean_squared_error", cv=10)
forest_rmse_cv=np.sqrt(-forest_scores)
display_cv_scores(forest_rmse_cv)
Scores: [47632.49179689 46373.11835198 49272.19573687 50147.15388662
 49036.42363423 53397.31601372 48902.61322735 50348.23351741
 51248.22704525 49552.02150292]
Mean: 49590.979471321756
Standard deviation: 1821.8742073775495
Important
Try different ML algorithms first, before spending too much time tweaking the hyperparameters of one single algorithm.
The first goal is to shortlist a few (2 to 5) promising models.

