Chapter 11 Iteration
11.1 Code Duplication
Code duplication is a significant problem in programming that should be avoided whenever possible. When you notice repetitive code within your script, it is generally not an ideal situation. Repeating the same code in multiple places can lead to difficulties in maintaining and debugging your script.
When the same code chunk is repeated in multiple places, it becomes challenging to track and update. If a bug is discovered or an improvement is needed, you have to make changes in every instance of the duplicated code, which is time-consuming and error-prone. It also makes the script harder to understand for other developers, as they have to navigate through redundant code segments.
To mitigate these issues, it is advisable to refactor the duplicated code into reusable functions or modules. By encapsulating the common functionality in a single place, you can reduce redundancy and improve code maintainability. In short, there are generally two major ways to reduce duplication in coding:
- Wrap the duplicate procedures into a function
- Use iteration structure in script
In this chapter, we will talk about code efficiency. In particular, we will work with the library purr.
According to Wickham & Grolemund (2017) Chapter 21 Iteration, there are three main advantages of reducing code duplication:
- It’s easier to see the intent/objective of your code, because your eyes are drawn to what’s different, not what stays the same.
- It’s easier to respond to changes required for code maintenance. Without much code duplication, you only need to make changes in one place, rather than remembering to change every place that you have copied-and-pasted the code.
- You’re likely to have fewer bugs because each line of code is used in a limited place.
11.2 Vectorized Functions: Vector vs. List
Most of the R-internal functions are vectorized. By default, if we apply a function to a multi-element vector, R will automatically apply the same procedure to all elements of the vector all at once, and return the results of the same vector’s length.
 [1] 1.000000 1.414214 1.732051 2.000000 2.236068 2.449490 2.645751 2.828427
[9] 3.000000 3.162278 [1] 1.00 1.41 1.73 2.00 2.24 2.45 2.65 2.83 3.00 3.16The concept of a vectorized function in R is important here. A vectorized function is designed to operate on an entire vector (or multiple vectors) as a whole, performing the same operation on each element simultaneously. It leverages the internal optimizations in R to process the vector efficiently, resulting in faster and more concise code.
But this is NOT something we can do with a list:
Error in sqrt(a.list): non-numeric argument to mathematical functionYou may now recall that in Chapter 5 , we have introduced the control structure of for-loop, which allows us to perform a specific procedure to every element of a list.
a.list <- list(1, 2, 3, 4, 5, 6, 7, 8, 9, 10)
results <- vector() # empty list holder

for(i in 1:length(a.list)){
  results[i] <- sqrt(a.list[[i]])
}

results
[1] 1.000000 1.414214 1.732051 2.000000 2.236068 2.449490 2.645751 2.828427
[9] 3.000000 3.162278In this chapter, we will explore more efficient ways of iterating over non-vector objects such as lists and data frames.
11.3 Iteration
Because we often work with list and data.frame (tibble) objects in R, it would be great if we can have a straightforward approach for performing the same procedure on:
- Each element in the
list - Each row in the
data.frame - Each column in the
data.frame
These three scenarios are the most-often used contexts for iteration (i.e., iterating over data structures).
Let’s start with a example. We first create a pseudo data set, i.e., a list with students’ grades from five different classes.
set.seed(123) ## control random sampling
exams.list <- list(
  class1 = round(runif(30, 0, 100)), # 30 tokens of random numbers in the range <0, 100>
  class2 = round(runif(30, 0, 100)),
  class3 = round(runif(30, 0, 100)),
  class4 = round(runif(30, 0, 100)),
  class5 = round(runif(30, 0, 100))
)
exams.list
$class1
[1] 29 79 41 88 94 5 53 89 55 46 96 45 68 57 10 90 25 4 33 95 89 69 64 99 66
[26] 71 54 59 29 15
$class2
[1] 96 90 69 80 2 48 76 22 32 23 14 41 41 37 15 14 23 47 27 86 5 44 80 12 56
[26] 21 13 75 90 37
$class3
[1] 67 9 38 27 81 45 81 81 79 44 75 63 71 0 48 22 38 61 35 11 24 67 42 79 10
[26] 43 98 89 89 18
$class4
[1] 13 65 34 66 32 19 78 9 47 51 60 33 49 95 48 89 91 61 41 15 94 30 6 95 72
[26] 14 55 95 59 40
$class5
[1] 65 32 31 22 37 98 15 9 14 69 62 89 67 74 52 66 82 79 98 44 31 41 1 18 84
[26] 23 24 8 25 73If we want to compute the mean scores of each cluster, you probably want to use mean():
[1] NAIt should be clear now that mean() expects a numeric vector, on which the mean score is computed.
So you might wonder, why not take a simple approach?
We can calculate the mean scores for each class and store all five scores in a list:
set.seed(123) # Make sure we get the same results
exams.list.means <- list(
  class1mean = mean(exams.list$class1),
  class2mean = mean(exams.list$class2),
  class3mean = mean(exams.list$class3),
  class4mean = mean(exams.list$class4),
  class5mean = mean(exams.list$class5)
)

exams.list.means
$class1mean
[1] 57.23333
$class2mean
[1] 43.86667
$class3mean
[1] 51.16667
$class4mean
[1] 51.86667
$class5mean
[1] 47.76667The disadvantage is obvious: (a) what if you have 10 classes? 100 classes? (b) what if now you decide to compute standard deviation?
The rule-of-thumb is that the more you find code duplication in your script, the more likely you need to restructure your codes with iterations.
11.4 purr
Now let’s take a look at how iteration structures can help us with repeated procedures.
$class1
[1] 57.23333

$class2
[1] 43.86667

$class3
[1] 51.16667

$class4
[1] 51.86667

$class5
[1] 47.76667With only one-line code, you can apply a function to each element of a data structure and obtain the results as a new data structure of the same type. It simplifies the process of applying a function iteratively and collecting the output at the same time.
map() is a very powerful function to do iteration. Its usage is as follows:
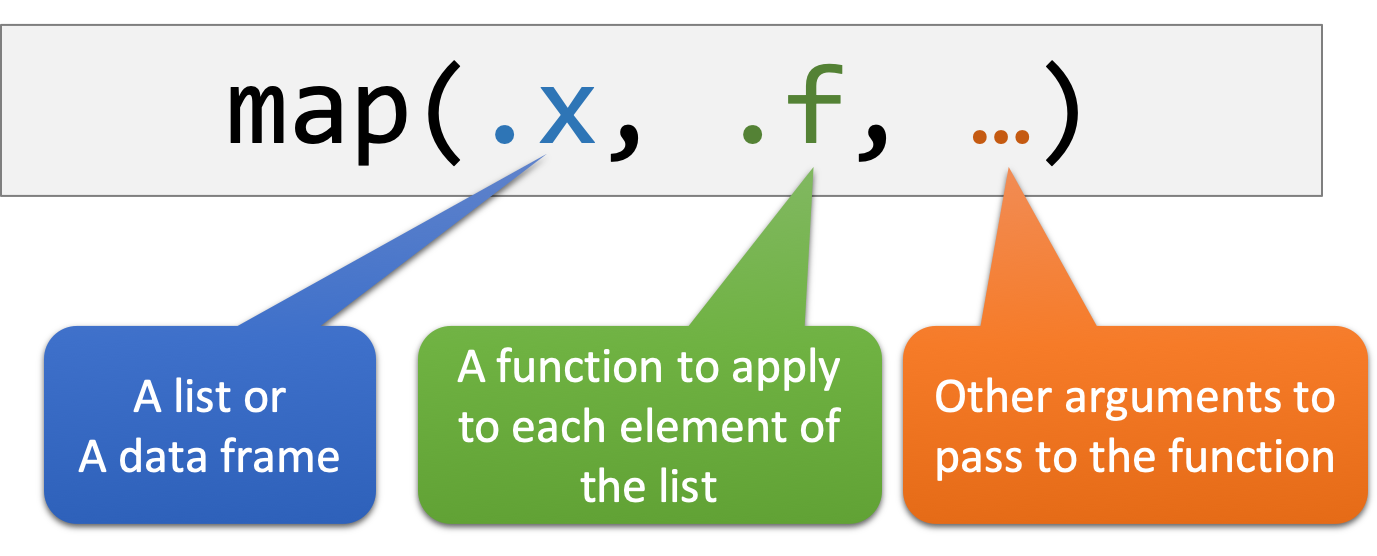
Let’s break down the code map(exams.list, mean) and explain it concisely:
- The
map()function is used to apply themeanfunction to each element in theexams.list. - The result of applying
meanto the first element is stored as the first element in a new list. - Similarly, the result of applying
meanto the second element is stored as the second element in the new list. - This process continues for each element in the
exams.list. - Finally, the function returns a list containing all the computed mean values.
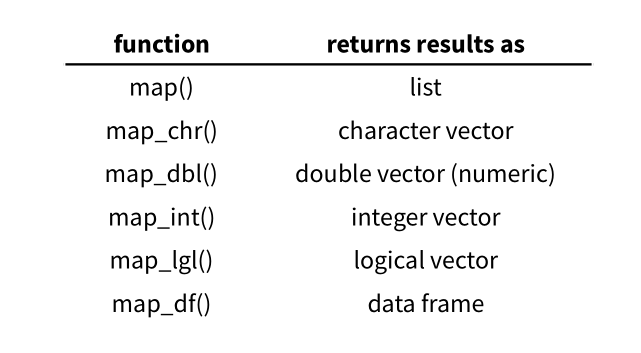
In the purrr package, the map() function defaults to returning the result as a list. However, you can use other variants of the mapping function, like map_dbl() for a double vector, map_int() for an integer vector, or map_chr() for a character vector, to specify a different output data structure. These variants allow you to tailor the output format based on your specific requirements.
## apply `mean()` to all elements of `exams.list`
## and return the output as data frame
map_df(exams.list, mean)
## apply `mean()` to all elements of `exams.list`
## and return the output as a double/numeric vector
map_dbl(exams.list, mean) class1 class2 class3 class4 class5
57.23333 43.86667 51.16667 51.86667 47.76667 In R, the apply() function, along with its variants like lapply() and sapply(), is a native R function used for applying a function to a specific data structure. These native R functions are very similar to map() in purrr library.
Here’s a brief comparison between apply() and map() from the purrr library:
apply(): It is primarily used with matrices or multidimensional arrays. It applies a function to either rows or columns of the matrix or array, aggregating the results. It is efficient for handling structured data and performing calculations across dimensions.lapply(): It applies a function to each element of a list or vector and returns a list of results. It is commonly used for iterative operations on lists and allows you to process each element individually.sapply(): It is similar tolapply()but simplifies the result by attempting to convert it into a more convenient format, such as a vector or matrix. It is useful when you want a simplified output and don’t necessarily need a list structure.map()(from purrr): It is part of the purrr library, which is an extension of the apply family of functions.map()provides a consistent and powerful approach to iterate over elements in various data structures, including lists, data frames, and vectors. It returns a list as the output, allowing you to work with the results in a flexible manner.
In summary, while the native R functions like apply(), lapply(), and sapply() provide useful ways to iterate over data structures, map() from the purrr library offers additional flexibility and consistency when working with lists, data frames, and vectors. It is particularly beneficial when you need to apply a function to multiple elements and handle the results in a list format.
Exercise 11.1 Use the same dataset, exams.list, and compute the median and standard deviation values for each class. Have these values returned as vectors.
- Median
class1 class2 class3 class4 class5
58.0 39.0 46.5 50.0 42.5 - Standard Deviation
  class1   class2   class3   class4   class5
29.05249 29.02167 28.04563 28.23392 29.31480
Exercise 11.2 Similar to the previous exercise, how can you use the same dataset, exams.list, to compute the median and standard deviation values for each class, and have both of these values returned as a data.frame (The first row refers to the median values and the second row refers to the standard deviation values.)
Please use map_df() to produce the following expected result.
11.5 purr + dplyr
When working with data frames in R, the map() function from the purrr library can be a powerful and efficient tool for data manipulation. When used in combination with the mutate() function from the dplyr package, it allows for seamless transformation of columns in a data frame.
Specifically, in the context of data frame, map() can be used to apply a function to a column or a selected set of columns. Therefore, by combining map() with mutate(), we can efficiently apply a function to each column of a data frame and generate new columns based on the results.
To illustrate this usage, let’s look at an example of the four-character idioms dataset from the previous chapter.
## reading utf8 file
con <- file(description = "demo_data/dict-ch-idiom.txt",
            encoding = "utf-8")
texts <- readLines(con)
close(con)

## convert into data frame
idiom <- data.frame(string = texts)
idiom
Now if we would like to find out whether each idiom has duplicate characters in it, we can make use of regular expressions:
## Take a look at the first ten idioms
x <- idiom$string[1:10]

## Check whether they have repeated characters
str_detect(x, ".*(.).*\\1.*")
[1] FALSE FALSE FALSE FALSE FALSE FALSE TRUE TRUE TRUE FALSEWhat if we would like to include this information as an independent (new) column of data frame, idiom?
Two important things should pop up in your mind:
- We need
mutate()to help us create a new column - We need to apply the above procedure,
str_detect(), to each element in the columnidiom$string.
So far, we do not have to use map() because str_detect() is a vectorized function, i.e., when it takes a vector as its input, it performs the pattern matching for all the elements of the input string vector, and outputs a vector, which can be a perfect candidate for a new column.
What if we want to identify idioms that include Chinese Zodiac animal characters and add a new column showing the count of animal characters for each idiom?
It is clear that we need to use str_extract_all() to extract all possible matches from each idiom. And it should also be clear that the output of str_extract_all() is a list.
## Regex patter for animal characters
pat <- "[鼠牛虎兔龍蛇馬羊猴雞狗豬]"

## Add a new column
idiom %>%
  filter(str_detect(string, pat)) %>%
  mutate(animals = str_extract_all(string, pat))
So now the question is: how can we get the information (i.e., the number of animal characters) from the output of str_extract_all() and add this information to the existing data frame as a new column?
And the hint is clear: you need to make use of the iteration function: map().
See if you are able to produce an output as shown below using the code template provided:
## Code Template
idiom %>%
  filter(str_detect(.......)) %>% ## include target rows
  mutate(animals = str_extract_all(......)) %>% ## extract all matches
  mutate(num_animal = map(......)) %>% ## compute number of matches for each idiom
  arrange(......) %>% ## arrange the results (optional!)
  select(-animals) ## remove irrelevant columns (optional!)
Exercise 11.3 In this exercise, you will work with a subset of idiom that includes only four-word idioms containing at least one duplicate character.
Your task is to create a new column that shows the number of unique duplicated characters in each idiom.
For example:
- In 阿狗阿貓, there is one duplicated character: 阿.
- In 矮矮胖胖, there are two duplicated characters: 矮 and 胖.
Exercise 11.4 Building on the previous exercise 11.3, please create another column that lists all the duplicate characters in each idiom.
For example:
- In 阿狗阿貓, the duplicate character is 阿.
- In 矮矮胖胖, the duplicate characters are 矮_胖.
If an idiom has more than one duplicate character, use _ as the delimiter to combine all the duplicate characters into a single string.
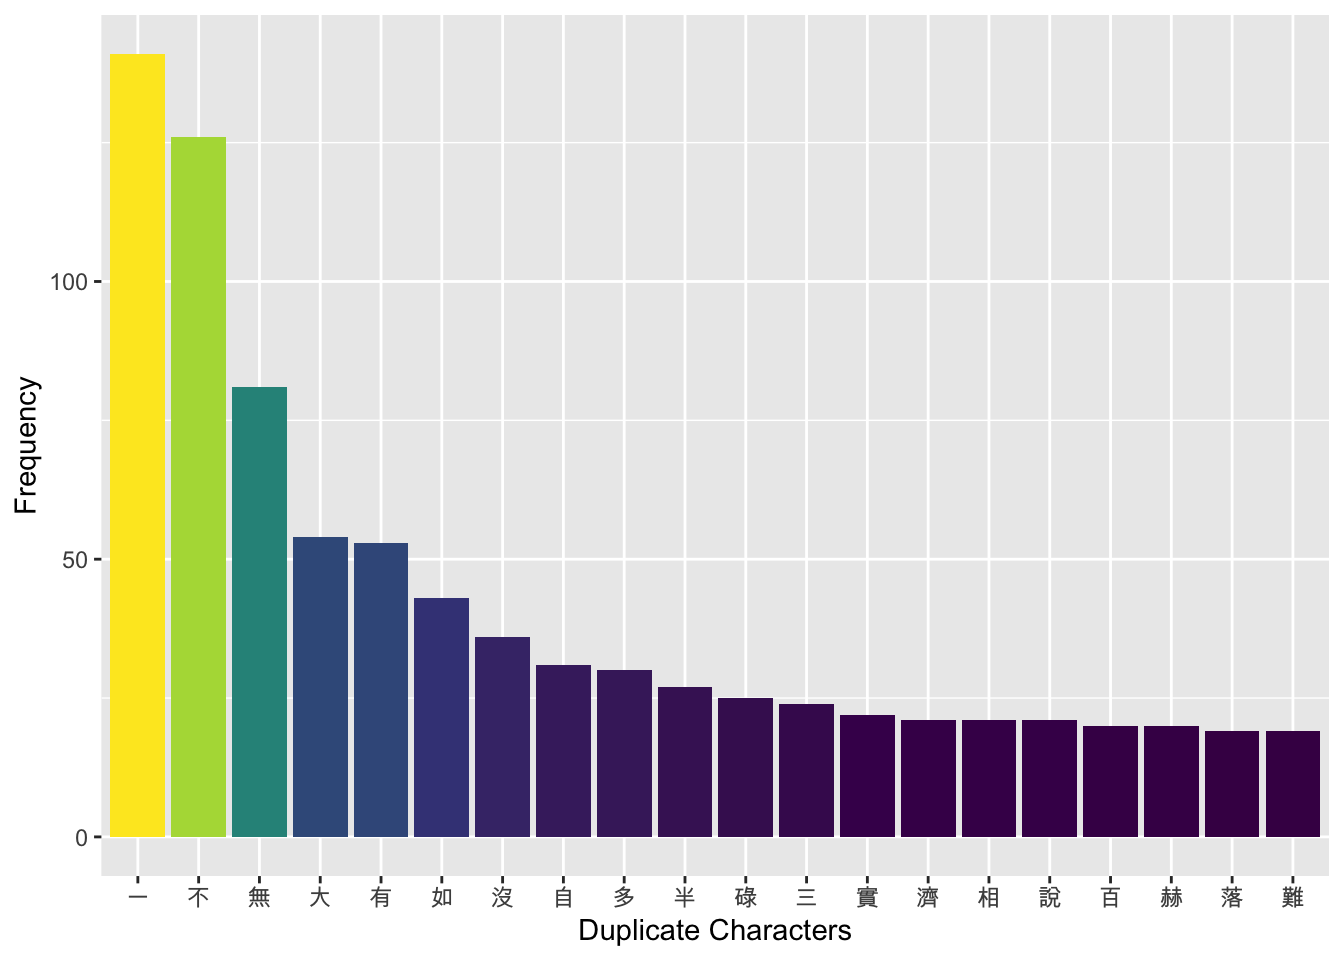
Exercise 11.5 Using the duplicate_char column from the previous exercise 11.4, analyze the distribution of duplicate characters in the four-character idioms in the dictionary. Identify the top 20 most frequently duplicated characters.
Then, create a bar plot to visualize the results, showing both the top 20 duplicate characters and the number of times each character is duplicated in the idiom.
11.6 map() with self-defined functions
With the power and flexibility of purrr::map(), we can basically do everything iteratively. More attractively, we can apply a self-defined function as well! (Please see Chapter 6 for how to create a self-defined function in R.)
A function object is defined using the following template:
A function object usually include:
- Self-defined name
- Arguments
- Return
Let’s consider a simple example.
First we define a custom function called my_center():
- This function takes a vector object
xas its input argument; - It subtracts each element of
xby the mean score ofx, and divides the difference by the standard deviation ofx; - The resulting vector is returned as the output of the function.
Now we can apply our my_center function to each element (e.g., the scores of each class) in exams.list:
$class1
 [1] -0.97180428  0.74921865 -0.55875878  1.05900278  1.26552553 -1.79789529
 [7] -0.14571327  1.09342323 -0.07687236 -0.38665648  1.33436644 -0.42107694
[13]  0.37059360 -0.00803144 -1.62579299  1.12784369 -1.10948612 -1.83231575
[19] -0.83412245  1.29994599  1.09342323  0.40501406  0.23291177  1.43762782
[25]  0.30175269  0.47385498 -0.11129282  0.06080948 -0.97180428 -1.45369070

$class2
 [1]  1.796358685  1.589616637  0.866019468  1.245046556 -1.442600069
 [6]  0.142422300  1.107218524 -0.753459909 -0.408889828 -0.719002901
[11] -1.029115973 -0.098776756 -0.098776756 -0.236604788 -0.994658965
[16] -1.029115973 -0.719002901  0.107965292 -0.581174869  1.451788605
[21] -1.339229045  0.004594268  1.245046556 -1.098029989  0.418078364
[26] -0.787916917 -1.063572981  1.072761516  1.589616637 -0.236604788

$class3
 [1]  0.5645561 -1.5035021 -0.4694730 -0.8616909  1.0637426 -0.2198798
 [7]  1.0637426  1.0637426  0.9924302 -0.2555359  0.8498055  0.4219314
[13]  0.7071808 -1.8244077 -0.1129112 -1.0399718 -0.4694730  0.3506191
[19] -0.5764415 -1.4321898 -0.9686595  0.5645561 -0.3268483  0.9924302
[25] -1.4678459 -0.2911921  1.6698976  1.3489920  1.3489920 -1.1825965

$class4
 [1] -1.37659496  0.46516159 -0.63280866  0.50057998 -0.70364545 -1.16408459
 [7]  0.92560073 -1.51826854 -0.17236952 -0.03069594  0.28806961 -0.66822706
[13] -0.10153273  1.52771344 -0.13695113  1.31520307  1.38603986  0.32348801
[19] -0.38487989 -1.30575817  1.49229505 -0.77448224 -1.62452372  1.52771344
[25]  0.71309036 -1.34117656  0.11097764  1.52771344  0.25265122 -0.42029829

$class5
 [1]  0.5878714 -0.5378398 -0.5719523 -0.8789645 -0.3672775  1.7135827
 [7] -1.1177517 -1.3224265 -1.1518642  0.7243213  0.4855340  1.4065705
[13]  0.6560964  0.8948836  0.1444094  0.6219839  1.1677833  1.0654459
[19]  1.7135827 -0.1284903 -0.5719523 -0.2308277 -1.5953262 -1.0154143
[25] 1.2360082 -0.8448520 -0.8107395 -1.3565389 -0.7766271 0.8607711After centering, we have the standardized scores of all the students for each class. We can quickly identify students whose scores are one standard deviation above the class average.
Using the skills you’ve learned, do you have any ideas on how to approach this?
Exercise 11.6 Use the built-in the mtcars dataset (?mtcars for more detail).
How do you get the class type of each column in the mtcars by using map()?
Exercise 11.7 Create a self-defined function normalize() to convert each number of a numeric vector to a “z” score.
[1] -0.9779865 -0.5704921 -0.2988292 0.2444966 1.6028112Exercise 11.8 Use the earlier dataset exams.list. For each element in exams.list, please convert the student’s score to a z-score by applying your self-defined function in an iterative structure (e.g., map).
Please present the result as a data frame.
Exercise 11.9 Use the custom function normalize (created in a previous exercise 11.7) to standardize all numeric columns in the mtcars dataset. Utilize the map_*() functions from the purrr package to apply the normalization explicitly.
Present the results as a single data frame showing all normalized columns.